Best Practices Spotlight
Best Practices Spotlight
This is our most recent Best Practices Spotlight article. Please see the left-hand navigation for a list of additional articles.
Seamless Rides
A Practitioner’s Guide to DRT Data Standards and What They Mean for Your Agency
June 2026
Your dispatcher takes a call from a rider who needs transportation to dialysis three times a week. She’s Medicaid-eligible and already in your system. She’s a regular. But when she moves to a new county and calls the transit agency there, she starts from scratch: new paperwork, new eligibility verification, new everything. Her history doesn’t follow her.
Or consider this: a rider searches for transportation on a smartphone app, but your service doesn’t appear, even though you serve that exact area. So he calls a cab instead, or skips the appointment.
Or this: you and the transit agency one county over could easily share trips and save money for both of you. But handing off a trip means a phone call, a re-entry into their system, and a hope that nothing gets lost. So you mostly just don’t bother to coordinate.
None of these are failures of your agency. They are symptoms of a much larger issue: the systems that are used to run demand-response transportation (DRT) were built at different times, by different companies, for different purposes, and they were never designed to talk to each other. Many rural agencies have general public DRT. A rider’s eligibility, trip history, and service options can’t move freely between systems the way they should to efficiently provide necessary transportation services.
A community of researchers, State DOTs, transit agencies, and national organizations including National RTAP is working to fix that. They are writing or supporting shared rulebooks, known as data standards, that define a common language to exchange digitized information. This article explains where that work stands, what it means for rural and small-urban agencies, and what practical steps you can take right now.
Why a Common Language Matters
Think about booking a flight with a connection. You might book it directly on the airline’s website, through Expedia, through a travel agent, or through your employer’s travel portal; no matter where you booked, you check in once, your boarding pass works at every gate, your luggage moves from the first plane to the second without you touching it, and the gate agent at your connection can see your original reservation even though it was booked somewhere else entirely. This happens because the airline industry agreed on shared rules for how their systems communicate. Every airline, every booking site, and every airport follows the same rulebook, so the pieces fit together automatically, regardless of where the trip originated. Airline staff did not need to make individual arrangements with every booking channel and every connecting carrier.
Demand-response transportation (DRT) doesn’t have that yet. When your scheduling system and your Medicaid billing platform need to share information, someone usually has to retype it. When your agency and the county next door want to coordinate a trip, you rely on phone calls and informal agreements. When a rider tries to find your service on a smartphone app, your flexible routes and booking procedures are often too complicated for the app to display accurately.
Data standards are the airline industry’s shared rulebook, and these standards can be applied to transit. When agencies and vendors agree to follow the same digital format and order or operations, systems can exchange information automatically, saving staff time, reducing errors, increasing access, and making coordination possible at a scale that would otherwise be too costly to manage.
Why One Standard Can’t Do It All
DRT serves very different types of riders and services. A dialysis patient with Medicaid coverage, a senior using a volunteer driver program, a college student hailing an on-demand van, and a person with a disability using ADA paratransit all depend on demand-response transportation. Their trips are funded differently, managed differently, and operated with different rules. The data a Medicaid broker needs for a reimbursement claim is not the same data a volunteer coordinator needs to assign a driver. A standard built for one of these service types doesn’t automatically work for the others.
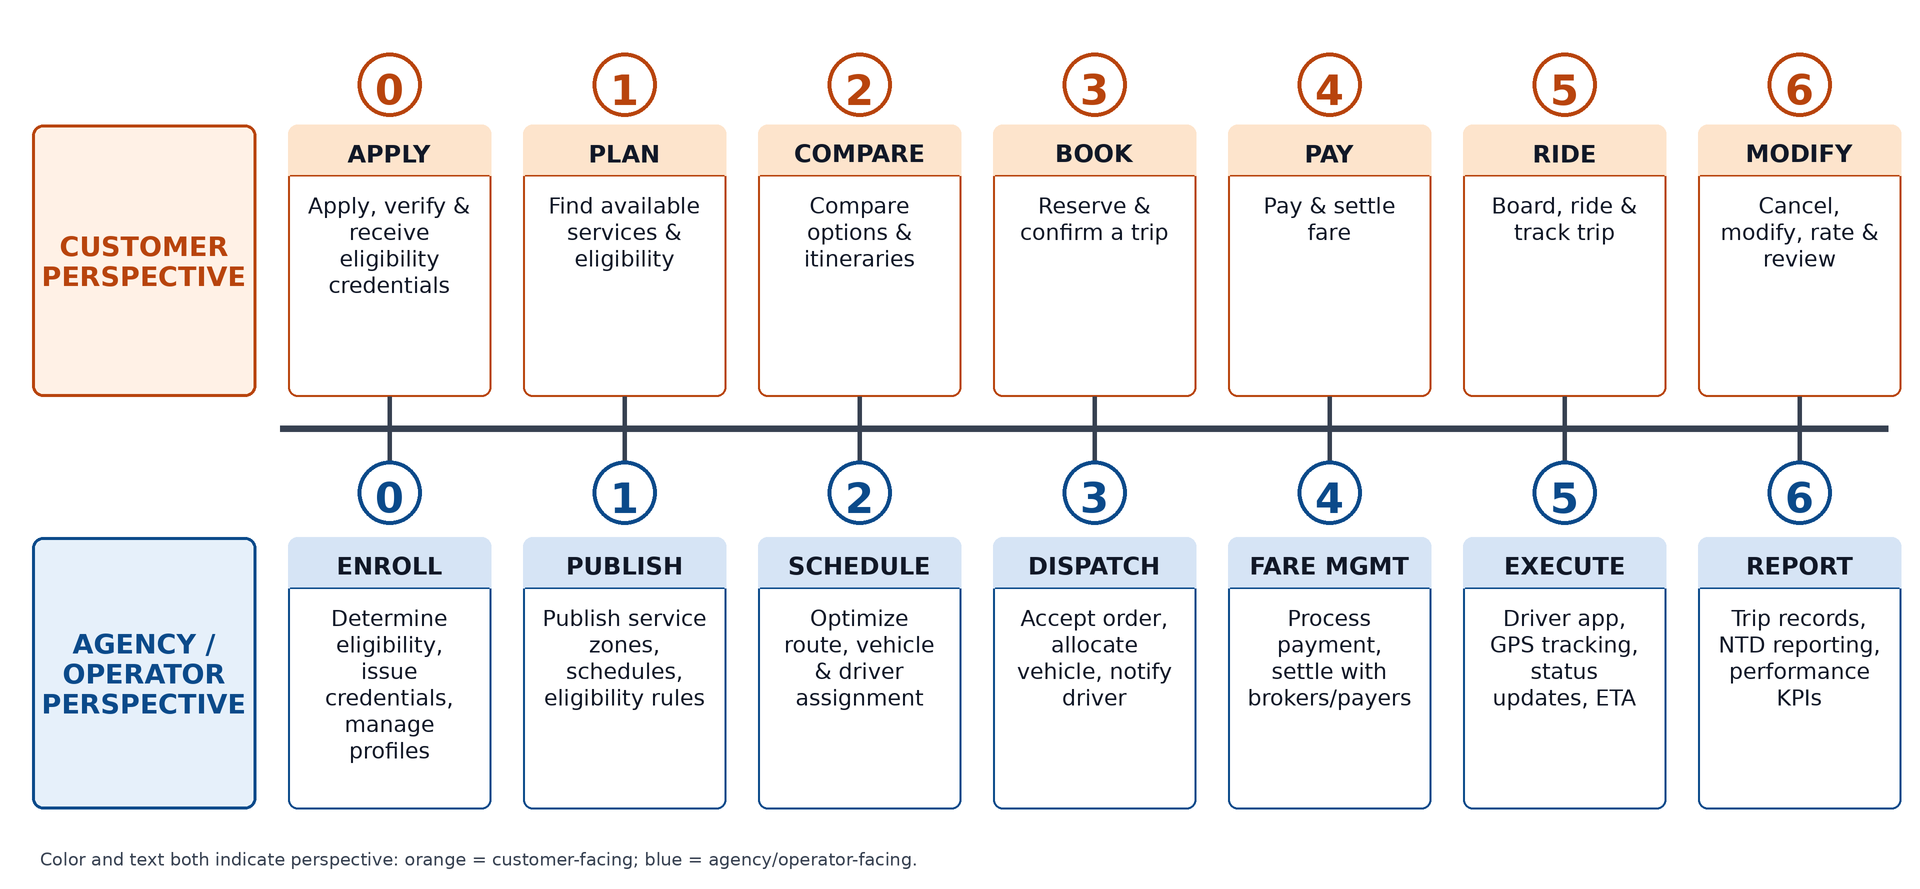
The rider and the agency are looking at the same trip very differently. From a rider’s perspective, a trip has seven stages (see figure below): finding the service, booking it, paying for it, riding, and managing changes. From the agency’s side, those same seven stages look like enrollment and eligibility verification, publishing service information, scheduling, routing, and dispatching a vehicle, processing payment and claims, executing the trip, and logging trip information for compliance reporting. These two storylines run in parallel, but most existing standards were designed to serve only one side. A standard that helps a rider find your service may do nothing for your dispatcher. A standard that helps your dispatcher manage a route may be invisible to the rider. Bridging the two sides is one of the core unsolved challenges in both standard development and customer access.
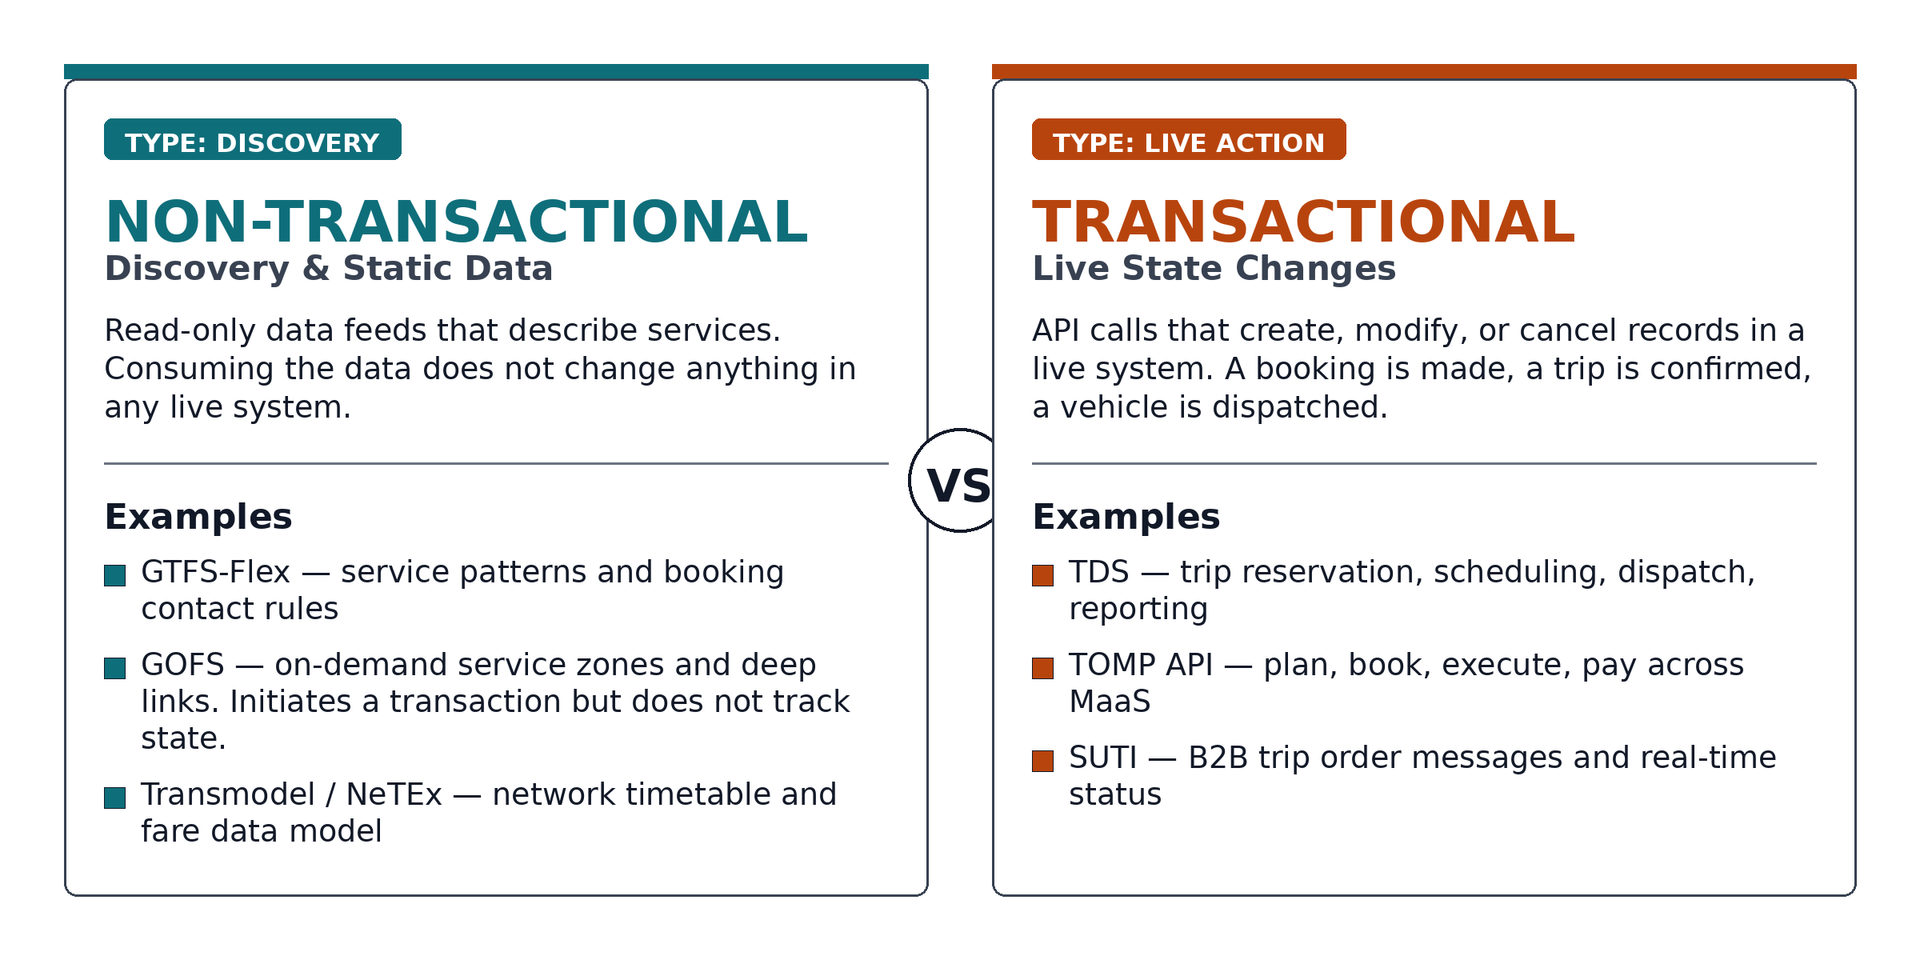
Some tools publish information. Others conduct transactions. This is the most important distinction to understand when evaluating any standard. A trip-planning app that shows your service area is using published, static information; reading it does not change anything in your scheduling system. But a booking confirmation, a trip cancellation, or a payment settlement are live transactions: they create or change a record in an operating system in real time. Standards that handle published data and standards that handle live transactions require completely different architectures, which is why, even within a single trip, you typically need more than one standard working together. The airline analogy holds here too: the app that shows you available flights (discovery) and the system that actually issues your ticket and updates the seat map (transaction) are built differently, even though they appear seamless to the traveler.
What the Different Rulebooks Cover
No single rulebook covers all of DRT. Different groups have developed different standards for different parts of the service. Here is what each one does in plain terms.
Getting your service on the map. One of the most immediately useful things a small agency can do right now is make its service visible to trip-planning apps. A standard called the General Transit Feed Specification-Flex (GTFS-Flex). GTFS-Flex (part of the GTFS fixed-route data standard) was formally adopted in 2024, and is now supported by apps like Transit, Moovit, Open Trip Planner and planning tools used by state 511 systems. GTFS-Flex lets your agency publish its service areas, schedule windows, and booking contact information in a format those apps can read. Riders searching for transportation see your service listed, not just fixed-route bus lines. Vermont, Maine, Minnesota, Washington,and dozens of other states have agencies already using it. National RTAP’s GTFS Builder supports GTFS (the data standard for fixed-route transit) and National RTAP is working to identify GTFS-Flex tools to support wider adoption.
Sharing trips across agencies. The Transactional Data Specification for Demand-Response Transportation (TDS), developed through the federal Transit Cooperative Research Program (TCRP), is the standard designed to let different agencies and vendors exchange trip information electronically. Instead of calling the neighboring county to hand off a trip, an agency’s scheduling and dispatching platform using TDS can adhere to the Health Insurance Portability and Accountability Act and send and receive trip requests automatically. Think of it as email for trip orders: it doesn’t matter what scheduling platform either agency uses, as long as both follow the same rulebook.
Active projects are underway in Minnesota, northeast Ohio’s NEORide consortium, the San Francisco Bay Area, and the Denver region. National RTAP is also supporting a DRT service coordination pilot with the Northern Kentucky Area Development District (NKADD) under the Community Rides Grant Program. A key component of the NKADD project is to outline a DRT service coordination framework, developing a concept of operations (how and what trips will be shared), data sharing agreements, and private vendor templates. These are the first steps to a trip coordination model and will serve as a future resource for interested agencies.
For example, in Minnesota, riders in rural counties can now request a DRT trip through a smartphone app, receive a confirmation, and cancel online without calling anyone. The dispatcher sees the request in their own scheduling system and accepts it directly. The trip information is shared via a TDS module developed for this project that takes the trip request and communicates with the participating transit agencies.
Another example, RideNoCo partnered with volunteer transportation providers in Larimer and Weld Counties, along with their technology vendors to refer rides among one another. Each software vendor directly integrated the TDS into their platform in order to exchange customer and trip information. Among other features, the TDS integration also supports a shared approach to determine rider eligibility. (Source: Benedict et al., “Connecting Community Transportation,” Shared-Use Mobility Center / AARP Public Policy Institute, 2024.)
Medical transportation standards. NEMTAC, the National Emergency Medical Transportation Accreditation Commission, is the only nationally accredited standards body focused specifically on non-emergency medical transportation. Three of its standards are approved and usable today: definitions for levels of service, modes of transportation, and passenger verification before boarding. Three more, covering data definitions, performance measures, and data exchange formats, are still being written. For agencies operating Medicaid, Veterans, or other funded medical trip programs, using NEMTAC’s common definitions in vendor contracts and interagency agreements reduces disputes, simplifies audits, and positions your agency well as DRT transactional standards mature.
On-demand transportation in multimodal mass-market consumer journey planning applications. General On-Demand Feed Specification (GOFS) is an consumer technology industry-driven, incrementally developed open standard convened by MobilityData, an open standards development organization. GOFS is in early use by a multi-modal mass market consumer journey planning application (Transit) and transportation systems including Pace On-Demand, Freebee Miami, and Taxi Montréal to display microtransit and ride-hailing options. This standard is helpful for agencies looking to improve information on demand responsive transportation in consumer journey planning applications.
International approaches with lessons for the U.S. A European standard called Transport Operator to Mobility-as-a-Service Provider API (TOMP-API) governs how a booking app communicates with a transport operator. More than 50 parties have implemented the TOMP-API, mostly in Europe, however, the standard is influencing how U.S. standard-setters (e.g., ongoing DRT standard development as part of USDOT-sponsored standards development effort for Reservation Scheduling and Dispatching) think about the rider-facing side of DRT. In the US, San Joaquin Council of Governments (SJCOG) has implemented the TOMP-API into Vamos Mobility.
Several Nordic countries, most notably Denmark, have used the
Standardized Utilization of Transport Information (SUTI) standard for over 20 years. SUTI is a technical communication protocol for DRT transactions. It served as the model for the more simplified TDS. It is extensively used by FlexDanmark, a publicly owned company overseen by Denmark’s regional transportation authorities, to interoperate more than 550 private DRT operators–from small mom-and-pop taxicab companies to large bus companies. The comprehensive standard allows FlexDanmark to commingle paratransit for people with disabilities, medical transportation, human-services transportation, and rural services for the general public. Its message formats record detailed information about each trip, enabling FlexDanmark to perform complex cost-allocation for various clients based on the number of trips provided, the number of passengers in the vehicle, service, and negotiated operator price. Together the SUTI and TOMP-API demonstrate that standards-based coordination models work at scale.
DRT Standards in Action: Where This Is Already Working
The following deployments draw on multiple sources including TCRP Report 210, the Shared-Use Mobility Center / AARP Public Policy Institute report “Connecting Community Transportation” (Benedict et al., 2024), AARP International, and National RTAP program documentation. They show that standards-based coordination is not a future concept. It is running today, in communities that look like the ones many National RTAP members serve.
These examples highlight GTFS-Flex and TDS use cases across the United States.
| Location | Agency Type | Service Type | Standard | What Changed for Riders and Agencies | Status |
|---|---|---|---|---|---|
| Southern & Western MN | State DOT + 3 rural transit agencies | Rural DRT + ADA paratransit | TDS + GTFS-Flex | Riders book DRT trips via smartphone app, receive confirmation, track vehicle, and cancel online, with no phone call needed. Reduced call center volume for agencies. | Live since Jan 2024 |
| Northern Colorado (RideNoCo) | MPO + 4 volunteer driver programs | Volunteer driver coordination, older adults & people with disabilities | TDS + GTFS-Flex | Trip requests passed electronically across 4 programs using 3 different scheduling platforms. Eliminates phone-based referrals between programs. | In-service deployment Fall 2024 |
| SW Ohio (NEORide) | NEORide is Council of 40+ transit agencies; Implementation involves BCRTA and SORTA | ADA paratransit + microtransit | TDS (middleware) | Cross-county booking without duplicate entry. Automated eligibility verification. One-call/one-click center (EZConnect) for riders across member agencies. | Successful test performed in Fall 2024 allowing Trapeze to push ADA paratransit trips to Via. |
| San Francisco Bay Area, CA | Regional MPO + 3 paratransit providers | ADA paratransit (cross-county) | TDS | Riders travel across county lines with one booking instead of two. Eliminates long waits at poorly-lit transfer points caused by separate county bookings. | In development Anticipated launch December 2027 |
| Vermont, Maine, Washington, Texas (in development), & others | State DOTs + local transit agencies | Flexible / dial-a-ride DRT service discovery | GTFS-Flex | DRT service areas, schedules, and booking contacts are visible in trip-planning apps. Riders find services they didn’t know existed. | Deployed |
| King County, WA (Hopelink) | Mobility coalition + ~30 HST providers | Human service transportation (Find a Ride Platform) | GTFS-Flex (TDS planned) | Find a Ride platform connects riders to transportation services across 3 counties from a single interface. https://www.findaride.org/ | GTFS-Flex in testing |
Three Problems That Standards Haven’t Solved Yet
Despite real progress, three operational headaches remain largely unsolved. You will recognize all three.
Finding a service and booking it are still two separate steps. When a rider finds your agency in a trip-planning app, they still have to make a phone call or visit a separate website to actually reserve a trip. A handful of proprietary Mobility as a Service (MaaS) solutions have overcome this; however, there is no scalable standard yet that connects the “finding” step to the “booking” step automatically, in the same way booking a flight online takes you from search to seat confirmation in one unbroken experience.
Medical trip billing is still a patchwork. Every Medicaid managed care organization, broker, and state program has its own billing format, its own eligibility verification process, and its own claim submission system. No common standard yet defines how a DRT trip cost should be calculated, how a subsidy should be applied, or how payment should be reconciled when multiple payers are involved in a single trip. The result is significant administrative overhead for agencies and a persistent source of billing errors and audit findings. The Coordinating Council on Access and Mobility Technical Assistance Center (CCAM-TAC) Cost Allocation Calculator is a resource for transit agencies that estimates the costs to run certain types of contract transportation services to determine the fully allocated costs. The tool standardizes a method for billing medicaid trips. The Tool accounts for shared ride service by presenting costs from the "purchaser of service" perspective. The funding agency is invoiced for each passenger's travel from origin to destination based on the least-cost path, rather than the actual path followed in typical shared rider scenarios (Robbie Sarles, President RLS & Associates, Inc.).
A rider’s eligibility doesn’t follow them. When a rider with ADA paratransit eligibility moves between counties, or needs to use a neighboring agency’s service, their eligibility almost certainly can’t be verified electronically. The next agency has to call yours, or the rider re-enrolls from scratch. No interoperable system exists yet for carrying eligibility across provider boundaries, similar to a boarding pass not working at a connecting gate. Moreover, each agency must pay a software vendor to design an eligibility screening tool for their unique requirements.
What to Do Right Now
You don’t need to wait for every standard to be finalized to start benefiting from this work. These practical steps apply regardless of your agency’s size or technology know-how.
Publish your service so riders can find it. If your agency offers any kind of flexible or demand-response service, ask your scheduling vendor or State DOT whether your service information is published in a format that trip-planning apps can read. If not, find out what it would take to get there. National RTAP’s GTFS Builder can help rural and Tribal agencies without dedicated technical staff get this done for fixed-route transit and we are working on opportunities to display GTFS-Flex. If you use scheduling and dispatch software, ask your vendor to provide GTFS/GTFS-Flex feeds.
Ask your vendors the right questions. When renewing contracts or issuing Requests for Proposals (RFPs) for scheduling or billing software, ask specifically: Can this system share trip information with another agency using a different platform? If so, how? Will the vendor rely upon its own, or the other platform’s proprietary API, or have they made their platforms compatible with standards such as the TDS? What are the associated costs to support sharing trip information across transit agencies and private vendors? Can it export data in nationally recognized formats? A practical note from early TDS implementers: many agencies are locked into multi-year vendor contracts that make no mention of data standards. When those contracts come up for renewal, TDS compatibility can and should be a procurement criterion. Requiring open standards integration protects your agency’s ability to change systems in the future, keep more vendors competing for your business, and allow new providers to enter the market, in the same way airlines that follow shared booking rules to put passengers on each other’s flights without renegotiating every route. Standards level the playing field, facilitate more competition, and thus help to keep costs in check.
Use common language in your agreements. When writing interagency coordination agreements or contracts with Medicaid brokers, use NEMTAC’s definitions for levels of service and modes of transportation. Common definitions reduce disputes, simplify audits, and prepare your agency for the more formal data exchange standards still in development.
Institutional Barriers. While transit standards like GTFS are widely adopted and are now a requirement of National Transit Database (NTD) reporting, there is still considerable work that needs to be done for DRT standards to realize the same scale. For example, commonly used trip planner apps (like Google or Apple Maps) do not display GTFS-Flex DRT service boundaries. Similarly for the TDS, there is a need for a governance model to coordinate existing and future use cases so that a unified data standard can be adopted. Recognizing these barriers upfront is essential for any new standards implementation. Advancing the TDS specifically will also require a dedicated budget to oversee its development and build out the specification for different use cases. A dedicated budget is also needed to work with private software vendors and to build support across government agencies and other public interests. As pilots mature into permanent deployments and operational and institutional barriers are overcome, the industry will move closer to a plug-and-play model comparable to fixed-route service under GTFS.
Strengthen and Build Local Partnerships. Start by finding out who else in your region is already trying to solve the same problem. A neighboring transit agency, a hospital system dealing with missed appointments, or a regional planning organization are all natural starting points and data stakeholders. One conversation often reveals that the groundwork for coordination already exists and just needs someone to formalize it.
From there, the work is about keeping momentum. Early agreements do not need to be comprehensive. A simple memorandum of understanding that defines who shares what, under what terms, and who is responsible when something goes wrong is enough to move from informal coordination to something that can be sustained and built upon. As trust develops and trip volumes grow, those agreements can be expanded. The agencies that have made coordination work long-term share one trait: they treated the first small agreement as a foundation, not a finish line.
Leadership from State DOTs and MPOs. State Departments of Transportation and Metropolitan Planning Organizations (MPOs) are in a unique position to support rural and Tribal transit technology needs. Both can provide economies of scale for technology investments, enhance smaller agencies’ technical capacity, alleviate staff time constraints when adopting a new technology, and more broadly serve as an opportunity to bring agencies together to discuss transit and technology needs. Similar to the partnerships, much of this already occurs, but more work is needed to formalize these discussions to build awareness and support around data standards. National RTAP offers resources to get started and convening opportunities for agencies to discuss these and other transit needs. Among National RTAP resources under development is a Transit Data Standards Resource Directory, that will help build awareness of data standards and link to technology and capacity building resources.
Where to Learn More
- National RTAP DRT Data Specifications Working Group: open to practitioners, meets regularly, focused on practical implementation. Contact Al Benedict at albenedict@nationalrtap.org or Jana Lynott, Independent Contractor at jana@janalynott.com
- TCRP Report 210: the full reference for the TDS standard, available free through the Transportation Research Board.
- Modernizing Demand-Responsive Transportation for the Age of New Mobility. Washington, DC: AARP Public Policy Institute, December 2020.
- FlexDanmark Optimizes Scandinavian Software Solution to Deliver Efficient, High Quality Transportation to Its Citizens: AARP International: The Journal, vol. 12: 52-57.
- FlexDanmark video series: AARP Public Policy Institute, 2019.
- Connecting Community Transportation: Lessons Learned from TDS Demonstration Projects: Benedict, Shamat, Seeskin, and Lynott. Shared-Use Mobility Center / AARP Public Policy Institute, 2024. Detailed case studies of TDS pilots in rural Oregon, Minnesota, Ohio, California, Colorado, and Washington.
- Mobility Standards and Guidelines Resource (MSGR) Tool: a searchable database of DRT-relevant standards maintained by N-CATT. (not currently online)
- NEMTAC standards: available at nemtac.org through the ANSI-ASD accreditation program.
About the Authors:

Santosh Mishra
Santosh is the President & CEO of Flexlynqs, a mobility innovation firm he has founded. For the last 2 decades, he has worked closely with hundreds of public sector agencies in digital transformation at the intersection of planning, policy, technology, and data. In addition, Santosh has led R&D of several next generation USDOT-funded transportation concepts, particularly focused on regional integration and coordination. He chairs the Transportation Research Board (TRB) research panels on AI in Transit operations and Transit Innovation (IDEA), and is a member of the panel on Fare Collection Policy and Technology. He also co-chairs USDOT/ITE MAT-RSD Subcommittee developing standards for flexible transportation. Further, Santosh is an internationally recognized leader in intelligent transport and serves as the ANSI-designated US delegate to ISO Technical Committee on Intelligent Transport: TC 204 where he is leading the development of multiple international standards, and has been appointed Convenor for Working Group on Public Transport and Emergency ITS (WG8).

Al Benedict
Al Benedict joined the National Rural Transit Assistance Program (National RTAP) team as the Technology Tools Lead and the Community Rides Grant Manager in 2025. As the Technology Tools Lead, Al works to understand the transit and technology needs for rural and Tribal agencies to help identify right size solutions and implementation frameworks. This work centers on National RTAP's technology tools and identifying and developing new resources to support rural and Tribal transit. Al also oversees the Community Rides Grant program, which is aimed at building and strengthening local transportation partnerships and the capacity of rural transit programs, increasing access to critical needs like employment, healthcare, education, healthy food, social services, or recreation. Prior to National RTAP, Al worked at the Center for Neighborhood Technology performing market analysis with land-use and public transportation, and most recently for the Shared-Use Mobility Center (SUMC). In his role at SUMC, Al led the knowledge-sharing and resource development in coordination with the Federal Transit Administration (FTA) mobility innovation team to support the development of public transportation technologies and transportation service models.

Jana Lynott
Jana is a consultant working at the confluence of planning and transit technology to support personal mobility. She brings more than 20 years of diverse transportation and policy experience from the non-profit, for-profit and public sectors. She is a nationally recognized thought leader with more than 30 publications on transportation and livable communities and is a strong advocate for public transit technology solutions and data standards. Her publications include Connecting Community Transportation: Lessons Learned from Transactional Data Specification Demonstration Projects, Innovations in Rural Public Transportation, and Universal Mobility-as-a-Service. She co-founded and co-convenes the Demand-Responsive Data Specifications Working Group, now housed under National RTAP. From 2007 to 2024, Jana was a senior transportation policy advisor in the AARP Public Policy Institute, where she also directed the organization’s Livability Index and data team.
Acknowledgements
Reviewed by Kari Banta, Program Manager, Section 5304 and RTAP Public Transportation Division Texas Department of Transportation. National RTAP Review Board Vice-Chair.
This document was prepared by National RTAP with the financial assistance of the U.S. Department of Transportation. The contents do not necessarily represent the opinions or policy of any agency of the U.S. Government, and the U.S. Government assumes no liability for the contents or use thereof. It does not have the force and effect of law and is not meant to bind the public in any way.
Updated June 29, 2026

A program of the Federal Transit Administration administered by the Neponset Valley TMA
National RTAP is committed to making this website accessible to persons with disabilities. If you need assistance accessing any content on our website or need alternative formats for our materials, please contact us at info@nationalrtap.org or 781-404-5020.